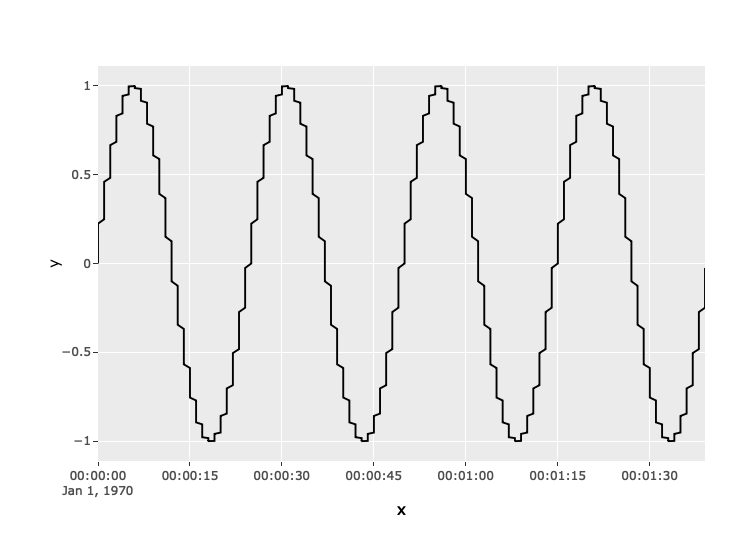
If I have a vector of POSIXct values with sub-second increments, then setting dynamicTicks to TRUE aggregates all the values by the second.
library(ggplot2)
library(plotly)
#>
#> Attaching package: 'plotly'
#> The following object is masked from 'package:ggplot2':
#>
#>     last_plot
#> The following object is masked from 'package:stats':
#>
#>     filter
#> The following object is masked from 'package:graphics':
#>
#>     layout
foo <- data.frame(x = as.POSIXct("1970-01-01", tz = "UTC") + (0:999) / 10,
                  y = sin((0:999) * 8 * pi / 1000))
p <- ggplot(foo, aes(x, y)) +
    geom_line()
ggplotly(p)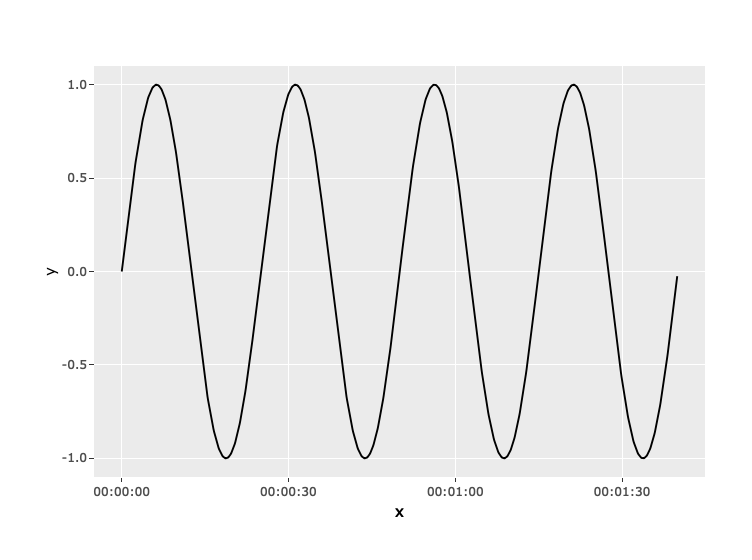
ggplotly(p, dynamicTicks = TRUE)
Created on 2020-10-24 by the reprex package (v0.3.0)
If I have a vector of POSIXct values with sub-second increments, then setting dynamicTicks to TRUE aggregates all the values by the second.
Created on 2020-10-24 by the reprex package (v0.3.0)